Who invented temperature loggers?
The quest to precisely quantify the sensation of hot and cold stretches back through the history of science, long before the advent of electronic recording devices we now call temperature loggers. While a single, definitive inventor for the modern temperature logger—a device designed to continuously record these measurements over time—is elusive, its very existence is built upon centuries of advancements in understanding and standardizing temperature itself. The foundational work required establishing what temperature is and how to measure it reliably, tasks undertaken by many great minds across generations. [2][7]
# Early Attempts
The very earliest indications of temperature measurement appear in the work of thinkers like Galen, a Greek physician from the second century AD, who categorized substances based on their perceived hotness or coldness, establishing a qualitative, rather than quantitative, system. [5][7] This was merely classification, not measurement. The first true instrument aimed at indicating temperature change is generally attributed to Galileo Galilei around 1593. [1][5] His device, often called a thermoscope, worked on the principle of the expansion and contraction of air when subjected to heat or cold. [2][5]
Another early attempt came from Santorio Santorio of Italy around 1636. [1][7] He refined Galileo’s concept by creating a sealed device that used liquid—likely alcohol—instead of just air, making it somewhat quantitative. [1][5] However, these early instruments had significant limitations: they were qualitative or at least lacked standardized scales, meaning a reading from one thermoscope couldn't be compared to another. [2][7] They also often required the observer to be present to read the device, inherently limiting their ability to capture data across extended periods. [2]
# Defining the Scale
The transition from a simple indicator to a true scientific thermometer required the establishment of a consistent, reproducible scale. [7] Several individuals contributed to this necessary standardization, which would eventually pave the way for automated recording.
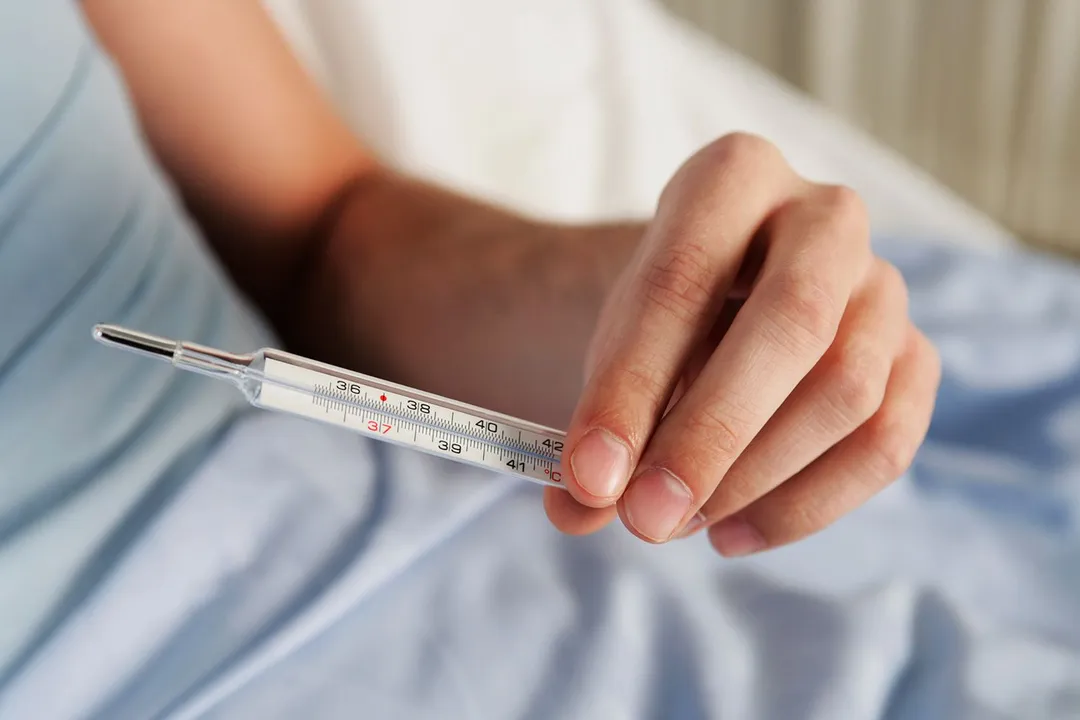
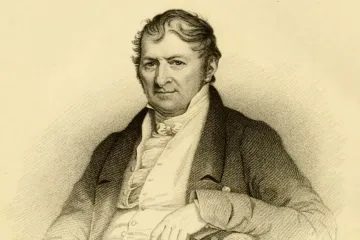
Daniel Gabriel Fahrenheit, born in 1686, is perhaps the most famous figure in this early standardization phase. [3][5] He is credited with inventing the mercury-in-glass thermometer and developing the Fahrenheit scale around 1714. [1][3][5] Fahrenheit’s scale used three fixed points: the temperature of a brine mixture (which he designated as ), the temperature of freezing water (), and human body temperature (which he initially set at ). [1][7] The use of mercury was a significant step, offering a more consistent thermal expansion than alcohol, which was also being used. [2][7]
Not long after, Anders Celsius introduced his centigrade scale in 1742, which used for boiling water and for freezing water, though this was later reversed by Carl Linnaeus to the modern convention where is freezing and is boiling. [5][7] The introduction of these fixed, reproducible points meant that a measurement taken in one location could be accurately compared to one taken elsewhere, a crucial step for any kind of data collection. [10]
The scientific community’s quest for the ultimate standard eventually led to the Kelvin scale, developed by Lord Kelvin (William Thomson) in 1848. [10] This scale is an absolute thermodynamic temperature scale, meaning $0$ Kelvin represents the theoretical point of zero thermal energy, or absolute zero. [10] While the realization of the Kelvin scale involved complex thermodynamic theory and was crucial for modern physics, the practical, everyday temperature logging that developed in industry often relied on the more easily accessible Fahrenheit or Celsius scales. [10]
# The Rise of the Sensor
The liquid-in-glass thermometer, though foundational, had inherent weaknesses: it was fragile, had a limited temperature range, and required visual inspection. [2][6] The true precursor to the modern logger needed a sensor that could be integrated into industrial processes and read remotely or automatically.
The next major evolution came with the introduction of the resistance thermometer, often credited to Sir Humphry Davy, Peter Desaga, and Werner von Siemens in the early to mid-1800s. [6][7] Siemens, in particular, is often recognized for developing the platinum resistance thermometer in 1871. [6][7] This type of sensor relies on the principle that the electrical resistance of a metal changes predictably with temperature. [6] Platinum was chosen due to its stability and linear response over a wide range. [6]
This electrical sensor was a game-changer. Unlike a glass tube, an electrical wire could be run from the sensor element in a process tank or a distant warehouse back to a control room or recording device. [2][6] This shift moved temperature measurement from a local, visual act to a remote, electrical signal—the essential first step toward automated data logging.
# From Indication to Recording
It is at this juncture, with the advent of reliable, remote electrical sensors like the platinum resistance thermometer, that the concept of the temperature logger begins to emerge, even if the first dedicated electronic logger did not have a single named inventor. [2] A logger is simply a sensor combined with a mechanism for storing time-stamped data.
Consider the manufacturing needs emerging in the late 19th and early 20th centuries. Industries like brewing, food preservation, pharmaceuticals, and chemical processing discovered that product quality wasn't just about the temperature at a specific moment—it was about the thermal history of the product. [2] A batch might need to be held at for exactly 4 hours, not 3 hours and 50 minutes, or 4 hours and 10 minutes.
Before dedicated loggers, recording this data required a dedicated human observer to check a remote gauge (like a resistance thermometer connected to a galvanometer) at set intervals (perhaps hourly) and manually write the value down next to the time on a paper chart. [2] This process was prone to human error, bias, and missed readings, especially during off-hours.
This difference between manual recording and automated logging highlights a core theme in scientific instrument evolution: the move from capturing a state to capturing a process. The thermometer captures the state; the logger captures the process. For instance, when monitoring vaccine storage, a single reading of is useless if the unit failed at for three hours overnight. The logger provides the evidence of compliance by recording the entire thermal profile. [2]

# The Technological Leap: Chart Recorders
The first practical, widespread solution to automated recording was the chart recorder. These devices, which began appearing in industrial settings in the early 20th century, were electromechanical devices. [2] They used the electrical signal from a temperature sensor (like a thermocouple or resistance thermometer) to drive a pen across a rotating drum covered in graph paper. [2]
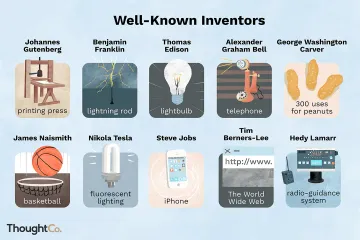
The genius of the chart recorder wasn't in inventing a new sensor, but in marrying existing sensors with an accurate mechanical timer. The pen movement reflected the temperature change, while the rotation of the drum provided the time axis. This eliminated the need for manual transcription and ensured a continuous visual record of temperature trends, spikes, and dips. [2] While we don't assign a single inventor to the chart recorder as a temperature logger, engineers like Thomas Alva Edison were heavily involved in developing related recording technologies in the late 1800s, providing the essential components for time-based data capture.
For a historical comparison of data capture methods, one can see a clear progression:
| Era | Measurement Device | Recording Method | Key Limitation |
|---|---|---|---|
| Pre-1700s | Thermoscope | Visual Observation | Non-standardized, required constant presence |
| 1700s–1850s | Standardized Liquid Thermometer | Manual Log Book | Intermittent readings, high human error |
| 1870s–1960s | Electrical Sensors (RTD/Thermocouple) | Chart Recorder (Pen/Drum) | Mechanical wear, required paper changes, difficult data extraction |
| Post-1970s | Electronic Sensors | Digital Data Logger | Data stored digitally, easier analysis |
This move to electromechanical recording was necessary because, while the Kelvin scale defined the physics, the industry needed a device that could reliably log data across an entire shift without fail. [10]
# Electronic Logging
The true "temperature logger" as we understand it today—a small, battery-powered box with internal memory—is a product of the digital revolution, not a single invention moment. The development required three things that only became widespread in the latter half of the 20th century:
- Miniaturized, stable electronic sensors: Moving beyond bulky platinum coils to solid-state thermistors or robust thermocouples. [6]
- Low-power microprocessors: To handle the timing, indexing, and memory storage efficiently. [6]
- Non-volatile digital memory: To retain data even when power is lost or the device is moved for data download. [6]
The introduction of solid-state electronics meant that the bulky, noisy mechanics of the chart recorder could be replaced by silent, compact solid-state memory chips. Engineers and software developers, rather than a single inventor like Fahrenheit, created the systems that allowed for thousands of time-stamped readings to be stored on a small chip, later offloaded to a computer for analysis.
An important realization for modern logistics is that the invention of the digital logger decoupled measurement from reporting. In the age of the chart recorder, the measurement device was intrinsically linked to the recording mechanism. The modern logger is a self-contained unit. This independence means a logger can travel across continents inside a refrigerated container, recording the environment invisibly, only revealing its data when plugged into a computer at the destination. This capability is what drove massive improvements in global supply chain integrity, far surpassing what the fixed, wired systems of the early 20th century could ever achieve. [2]
# The Legacy of Measurement Precision
While we may not have a singular "Mr. Logger" to credit, the entire field owes its existence to the precision achieved by the scientists who first defined and standardized temperature itself. [10] The work that led to the modern International Temperature Scale (ITS) and the redefinition of SI units, such as the Kelvin, ensures that the data captured by even the simplest modern logger is scientifically traceable back to fundamental physical constants. [10]
The history of temperature logging is therefore not a history of a single invention, but a story of convergence:
- Thermoscope: Proved temperature change could be indicated.
- Fahrenheit/Celsius: Provided the necessary shared language (scale).
- Resistance Thermometer (Siemens): Provided the robust electrical output signal.
- Chart Recorder: Provided the first continuous time-based record.
- Microprocessor/Digital Memory: Provided the small, non-volatile storage required for modern portability and ease of analysis.
The device used today—perhaps a small USB-powered logger adhering to GDP (Good Distribution Practice) standards in pharmaceuticals, or a wireless IoT sensor—is the successful synthesis of all these earlier milestones, fulfilling the need for continuous, objective data that human observers could never reliably satisfy. [2][6]
Related Questions
#Citations
Who invented the thermometer?
The History of Temperature Measurement
On This Day Daniel Gabriel Fahrenheit Born
History of Thermometers - Health BeatHealth Beat
Thermometer
A Brief History of the Temperature Sensor
The History of the Thermometer
Temperature Measurement – Past and Present. A Success Story
History of the Thermometer - PMC
Kelvin: History | NIST