Who invented pandemic dashboards?

The global scramble for clear, factual information that defined the early stages of the COVID-19 pandemic placed an intense spotlight on data visualization. Suddenly, millions of people worldwide needed reliable numbers to understand the spread of the novel coronavirus, turning obscure academic data sets into essential daily reading. The creation of the Johns Hopkins University (JHU) COVID-19 Dashboard stands as a defining moment in public health communication, spearheaded not by a traditional epidemiologist, but by an engineering professor tasked with making sense of chaos. [1][9]
# Engineering Data
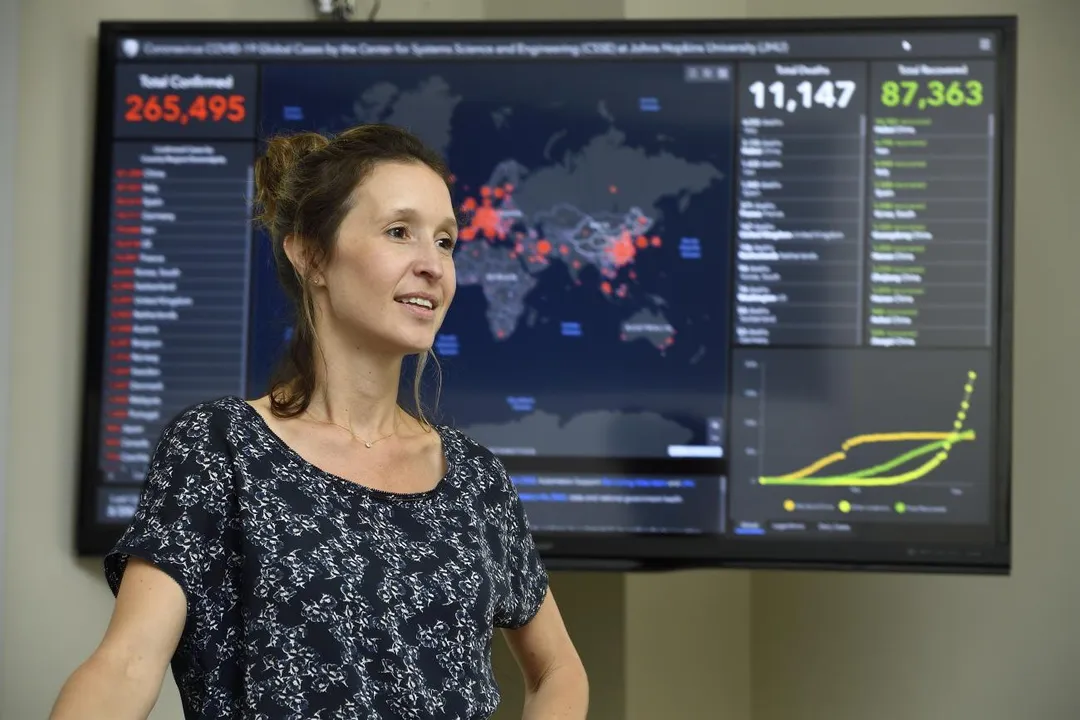
The driving force behind this globally recognized tool was Professor Lauren Gardner. [1][3] Gardner, who holds appointments in both the Johns Hopkins Bloomberg School of Public Health and the Whiting School of Engineering, brought a unique perspective to the crisis. [1] Her background is deeply rooted in engineering—specifically, how data informs the design and management of complex systems like transportation and infrastructure. [1] When the pandemic began to accelerate in early 2020, Gardner recognized an immediate, critical need: a way to track the virus that was accessible and rapidly updated. [9]
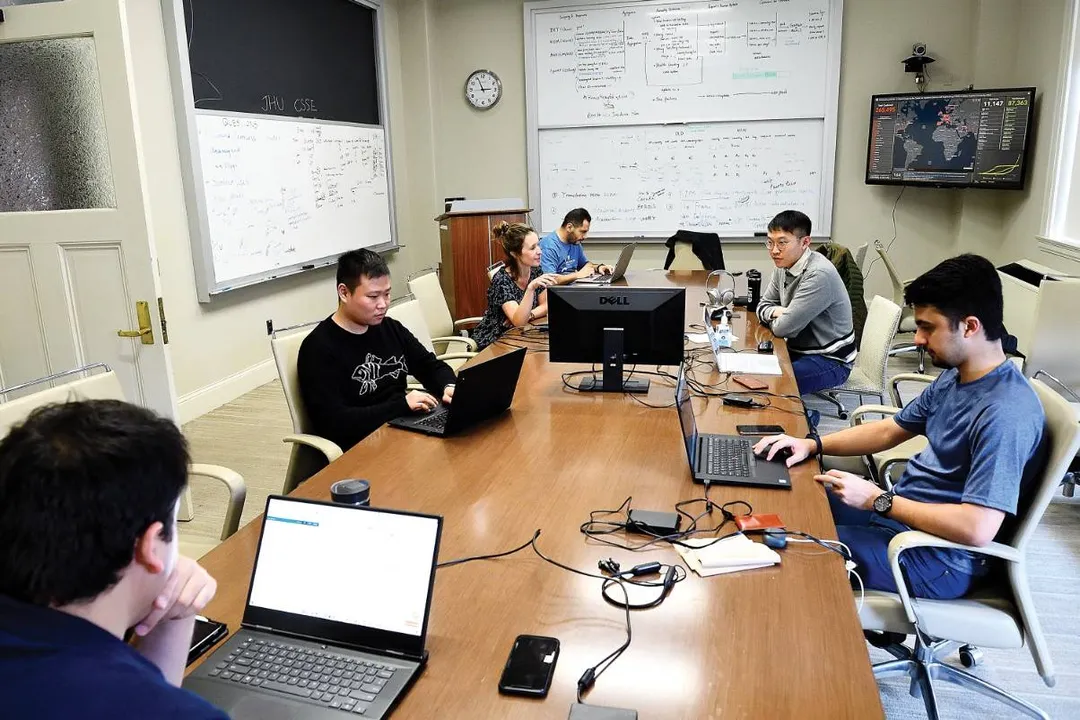
Gardner, along with her graduate student Dongqi Shen, took on the task of building the resource from the ground up. [1] This undertaking was not merely about presenting numbers; it was about synthesizing information from disparate sources that were often slow to update or hard for the general public to find. [2] The initial data collection relied on reports from established entities like the World Health Organization (WHO) and the Centers for Disease Control and Prevention (CDC). [2] The speed at which this project moved highlights a crucial element of its success: the ability of an engineering mindset to rapidly prototype and deploy a solution when bureaucratic processes often lag. [9]
The multidisciplinary nature of Gardner's work—bridging engineering principles with public health goals—proved essential. Many early data efforts were concentrated within clinical or statistical departments. However, the dashboard's efficacy stemmed from its focus on systems—how information flows, how users need to access it, and how the visualization itself drives action. This focus on functional delivery, a hallmark of engineering design, distinguished the JHU dashboard from more traditional academic reporting. [1]
# Building The Tool
The technical construction of the dashboard relied heavily on geographic information systems (GIS) technology. [2] Esri, the company specializing in GIS software, played a significant role in providing the foundational mapping capabilities that allowed the data to be displayed spatially. [2] The goal was to move beyond simple lists of case counts and allow users to see the geographic spread immediately. [2]
The challenge of creating a single source of truth was immense. The team aggregated data from multiple sources daily, including national and local health departments, not just international bodies. [2] This constant intake and standardization process required significant data wrangling. It meant developing processes to clean, verify, and normalize data reported using different methodologies or slightly different time stamps across various jurisdictions. [2] Think of it this way: if one county reported its cases based on when the patient was tested, and another reported based on when the lab confirmed the result, those numbers couldn't simply be added together without adjustment. The real invention here wasn't just the map, but the pipeline feeding the map. [2]
The early dashboard provided key metrics, such as confirmed cases, deaths, and recoveries, making these figures visually clear through interactive mapping. [5] The data science underpinning this involved more than just displaying counts; it involved the continuous effort to maintain accuracy amidst evolving reporting standards around the world, which is a testament to the rigor of the team behind it. [5]

# Global Impact

When the Johns Hopkins COVID-19 Dashboard went live, its immediate uptake was staggering. [3] Within weeks of its deployment in early 2020, it had become the world’s most frequently cited resource for tracking the virus's spread, receiving hundreds of millions of visits. [3][9] It became an almost default click for reporters, policymakers, and the general public seeking non-partisan updates. [3]
The accessibility of the information was key to its widespread adoption. By placing complex epidemiological data into an intuitive visual format, the dashboard democratized access to critical health information. [2] It bridged the gap between raw data streams and public understanding. For instance, a local official in a small town might use the JHU map to see how cases in their neighboring major city were trending, informing their own local response strategies, even if their local state reports were delayed or focused on a different timescale. [2]
This reliance on a single, trusted source for global data highlights an interesting societal development during the crisis. In the absence of highly centralized, instantaneous global reporting mechanisms, a university-led, academically grounded dashboard stepped in to fill the void. [3] The trust placed in Johns Hopkins—an institution with deep authority in public health—lent credibility to the data presented, which was vital in an environment saturated with misinformation. [3]
# Acknowledgment
The significance of this informational effort was formally recognized on a major stage. In recognition of her pioneering work in creating the dashboard, Professor Gardner was awarded the 2022 Lasker~Bloomberg Public Service Award. [1][6] This award, often regarded as an indicator of future Nobel recognition, specifically acknowledged her application of data science to confront a major public health emergency. [1][6] The committee noted that the dashboard served millions of people and provided a model for future public health data dissemination. [6]
The Lasker award underscores that inventing a system for data dissemination can be as important as discovering a cure. [6] Gardner’s team did not discover the virus, but they fundamentally changed how the world understood its progression, which in turn affected policy and personal behavior. [5] It reinforced the idea that in modern crises, the expertise of the engineer, the data scientist, and the public health expert must coalesce rapidly. [1] The success of this project, ultimately, was its ability to combine engineering precision with public service urgency. [3] The dataset compiled by the JHU team became a resource for researchers globally, contributing to scholarly analysis of the pandemic's dynamics. [4]
#Videos
Professor Lauren Gardner Discusses How the COVID-19 ... - YouTube
Related Questions
#Citations
COVID-19 dashboard creator Lauren Gardner wins Lasker ...
How Researchers Built the Johns Hopkins Dashboard - Esri
Professor Lauren Gardner—whose COVID-19 dashboard became ...
The COVID-19 Dashboard for Real-time Tracking of the Pandemic
Data scientists inventing new tools to rapidly analyze the spread ...
COVID-19 Data Dashboard Creator Lauren Gardner Wins Lasker ...
Professor Lauren Gardner Discusses How the COVID-19 ... - YouTube
The COVID-19 Dashboard for Real-time Tracking of the Pandemic
Johns Hopkins engineering professor Dr Lauren Gardner created ...